
Metrics and dimensions are two of the most basic ideas in data analysis—but they are also two of the most important. Every useful report, chart and dashboard is built by combining them.
What are we measuring?
A numeric value that can usually be aggregated.
- Revenue
- Profit
- Order quantity
- Average delivery time
How are we breaking it down?
A category, label, date or identifier used to group and filter the metric.
- Region
- Product category
- Customer segment
- Order date
What is a metric?
A metric is a quantitative value: something you want to count, total, average or otherwise measure.
Metrics are normally numeric, but the important point is not simply that they contain numbers. A metric represents an amount or a measurement that has analytical meaning.
Typical metrics include sales revenue, profit, number of orders, units sold, conversion rate and average handling time.
Metrics are normally aggregated
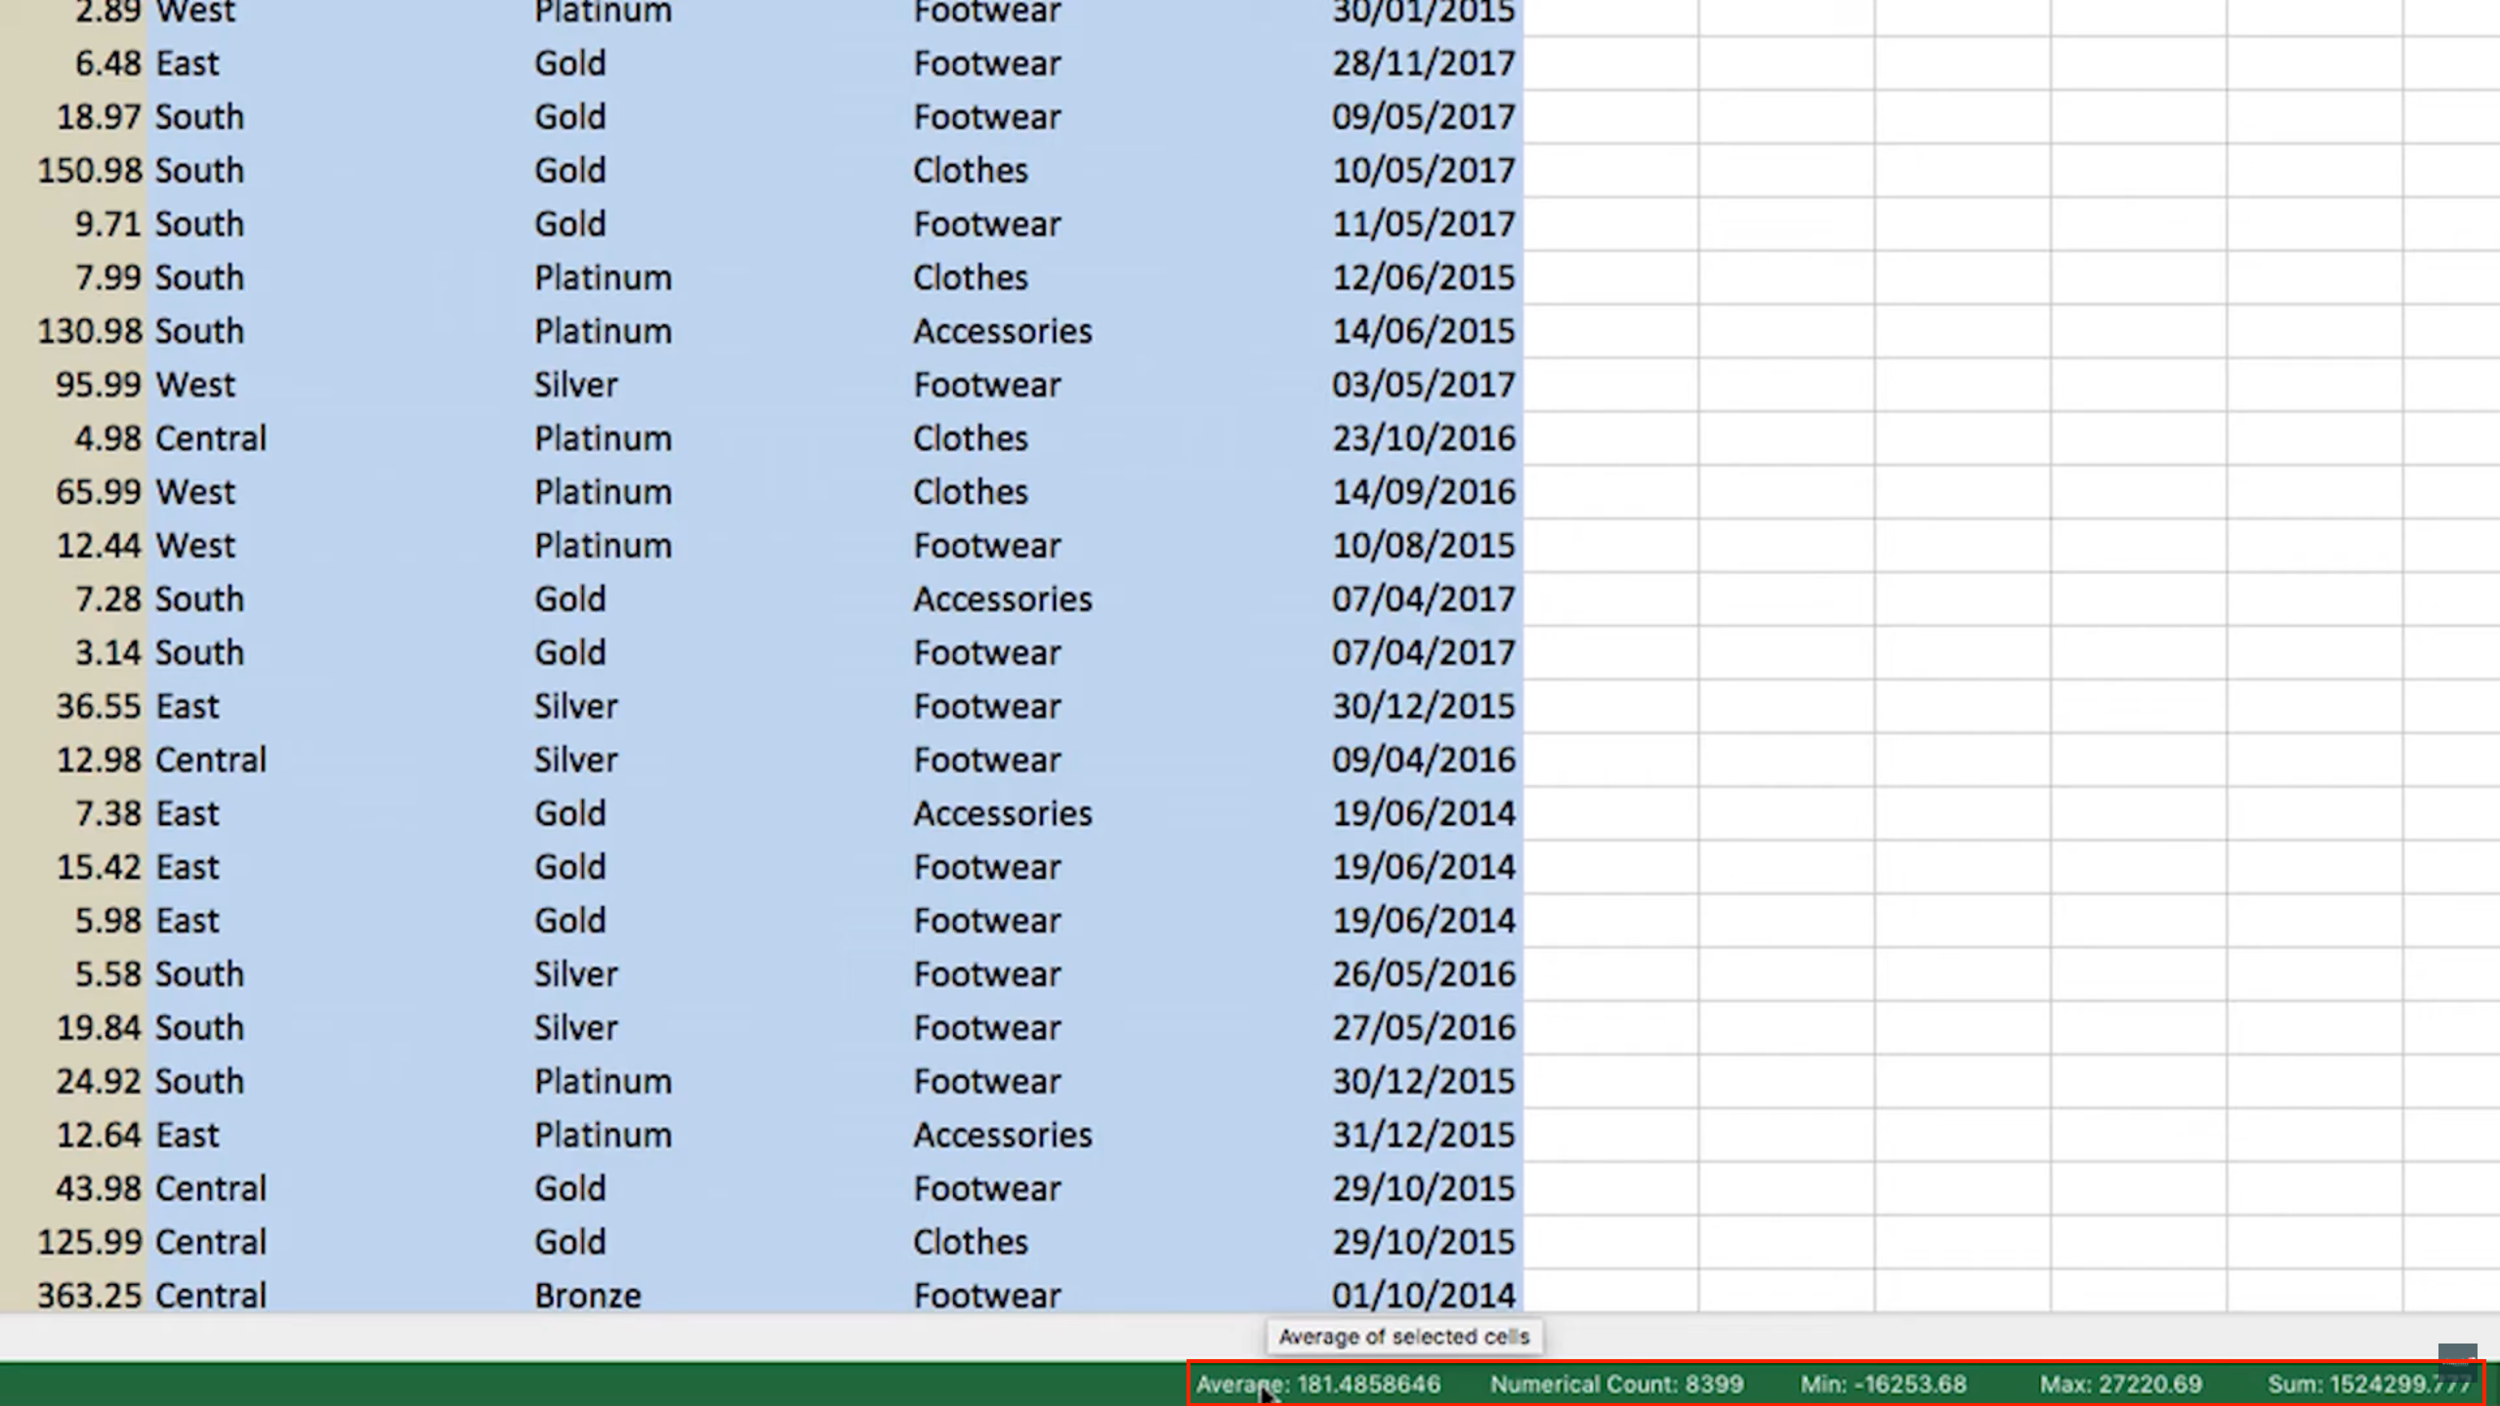
When a metric appears in a report, it is usually accompanied by an aggregation such as SUM, AVERAGE, COUNT, MIN or MAX. For example, a report may show the sum of revenue or the average delivery time.
That aggregation matters because a dataset often contains many rows. The BI tool needs to know how those individual values should be combined into a result.
What is a dimension?
A dimension is a field used to describe, categorise, group or filter your data. Dimensions provide the context around a metric.
They are often text fields such as region, product category or customer segment, but they can also be dates, Boolean values and numeric identifiers.
For example, an Order ID may be made entirely of numbers, but it is not normally a metric. You would rarely add Order IDs together. Instead, the value identifies or labels an order, so it behaves as a dimension.
Adam's advice
Do not decide whether a field is a metric or dimension purely from its data type. Ask what the field means and how you intend to use it. A number can be a label, and a date can be something you group by.
Metrics and dimensions only become useful together
A metric on its own gives you a figure. A dimension gives that figure context.
This is the pattern behind most business questions:
- Revenue by month
- Profit by product category
- Orders by customer segment
- Average resolution time by support team
The bold part is the dimension. The value being measured is the metric.
Identifying metrics and dimensions in a dataset
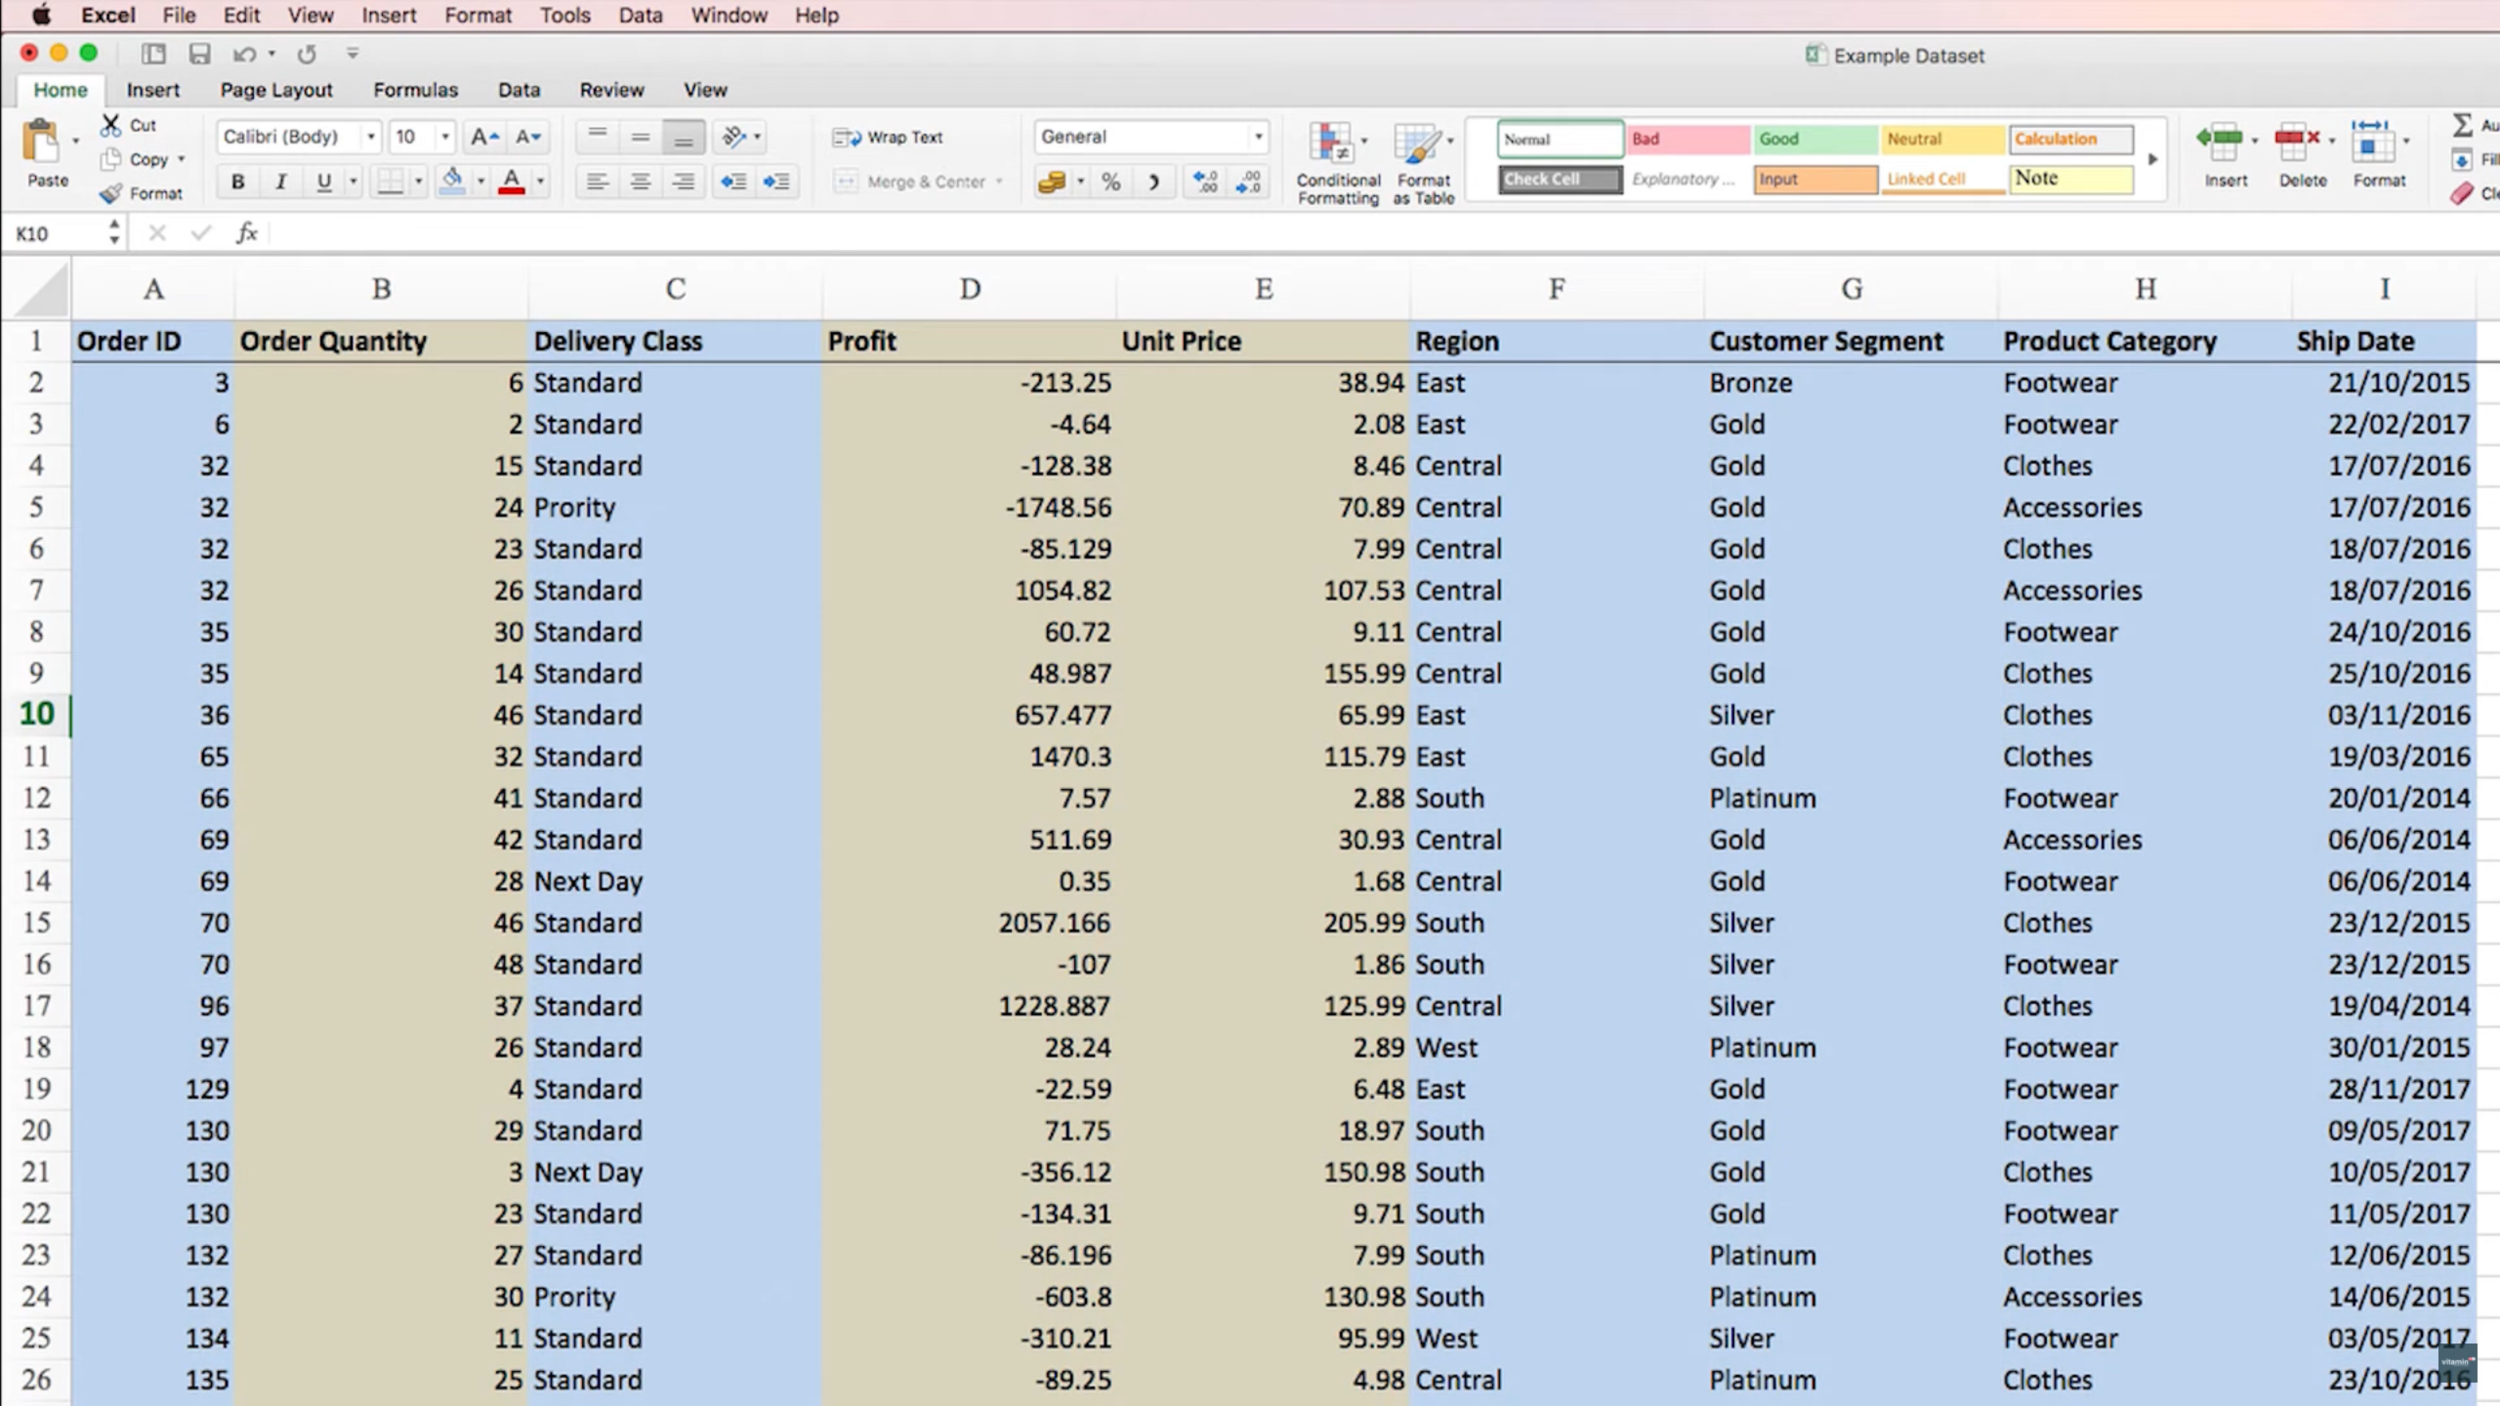
Consider a simple sales dataset containing one row per order line. The fields might look like this:
| Field | Example | Role | Why? |
|---|---|---|---|
| Order ID | 100427 | Dimension | Identifies an order; it is not meaningfully summed. |
| Delivery Class | Express | Dimension | Groups orders by service type. |
| Region | West | Dimension | Provides geographical context. |
| Order Quantity | 4 | Metric | Measures how many units were ordered. |
| Profit | £86.20 | Metric | Measures financial performance. |
| Ship Date | 2026-07-18 | Dimension | Can group or filter results over time. |
Why a single metric is difficult to visualise
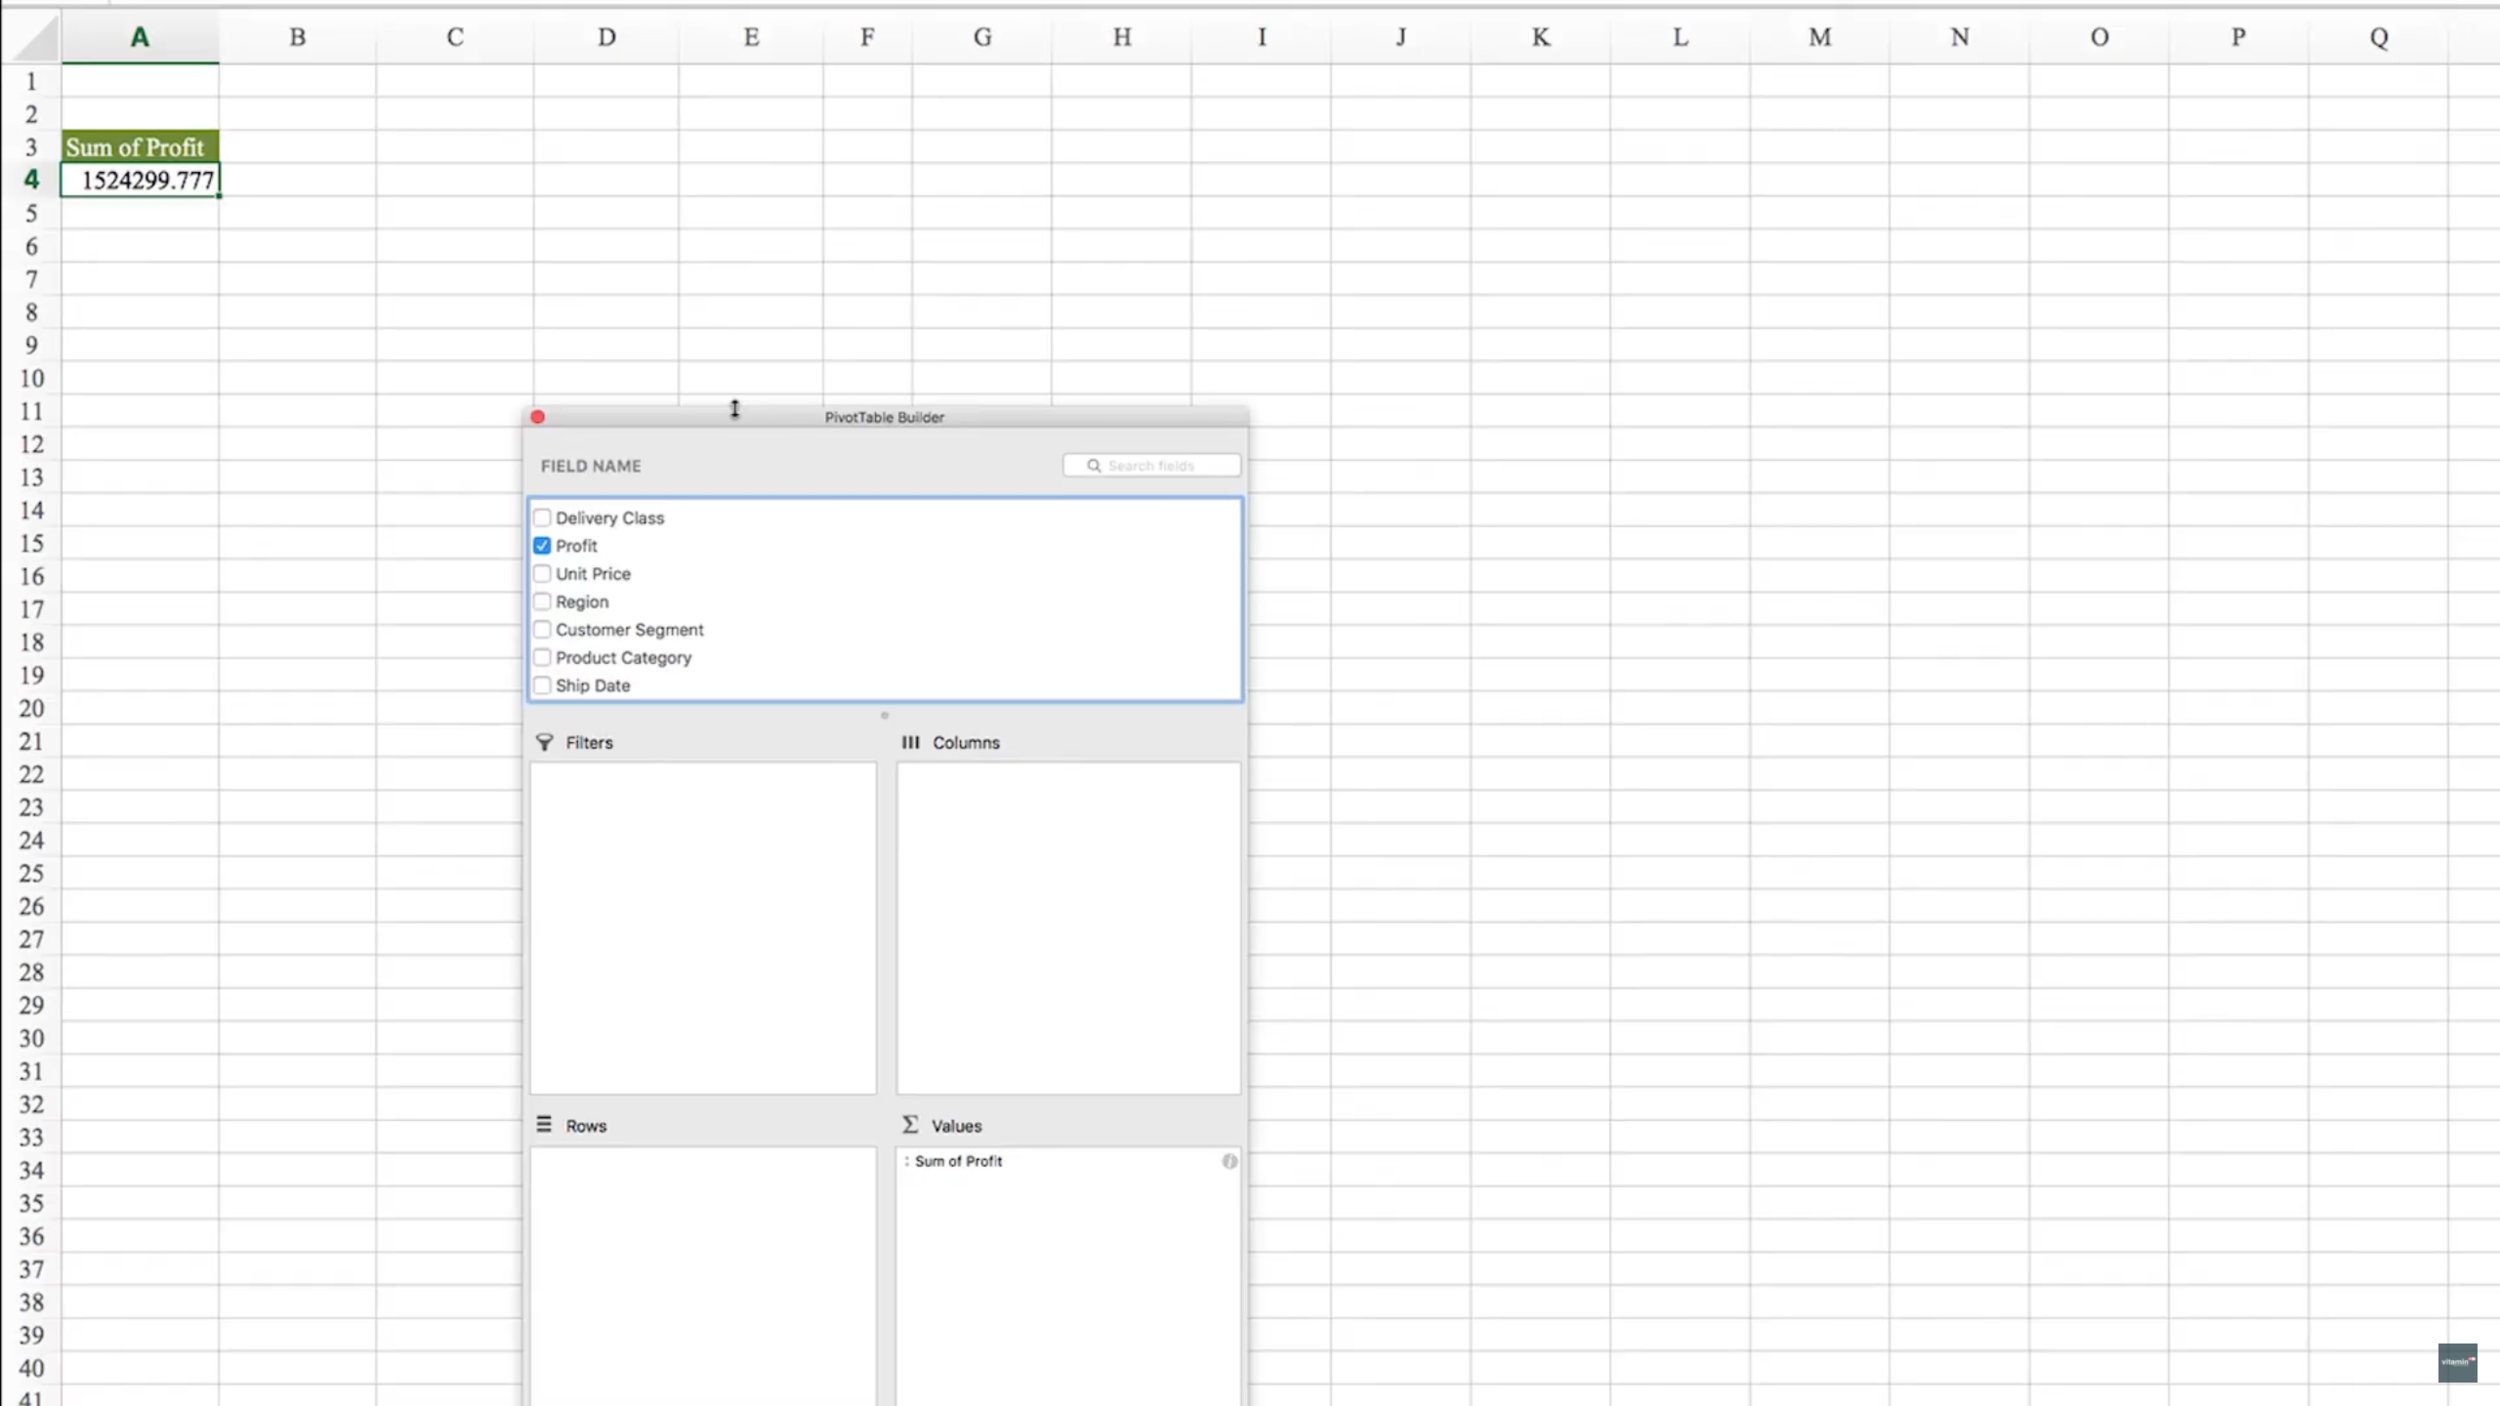
Imagine adding Profit to a pivot table as a value. Excel can calculate the total profit, but that gives you only one number.
A chart normally needs something to compare that metric against. Add Customer Segment as a dimension and the total profit is split into meaningful groups.

This same principle applies in Power BI, Tableau, Data Studio and almost every other reporting tool. You select a value to measure, then choose one or more dimensions to organise it.
Can a metric also be used as a dimension?
Yes. A field's role can change depending on the question you are asking.
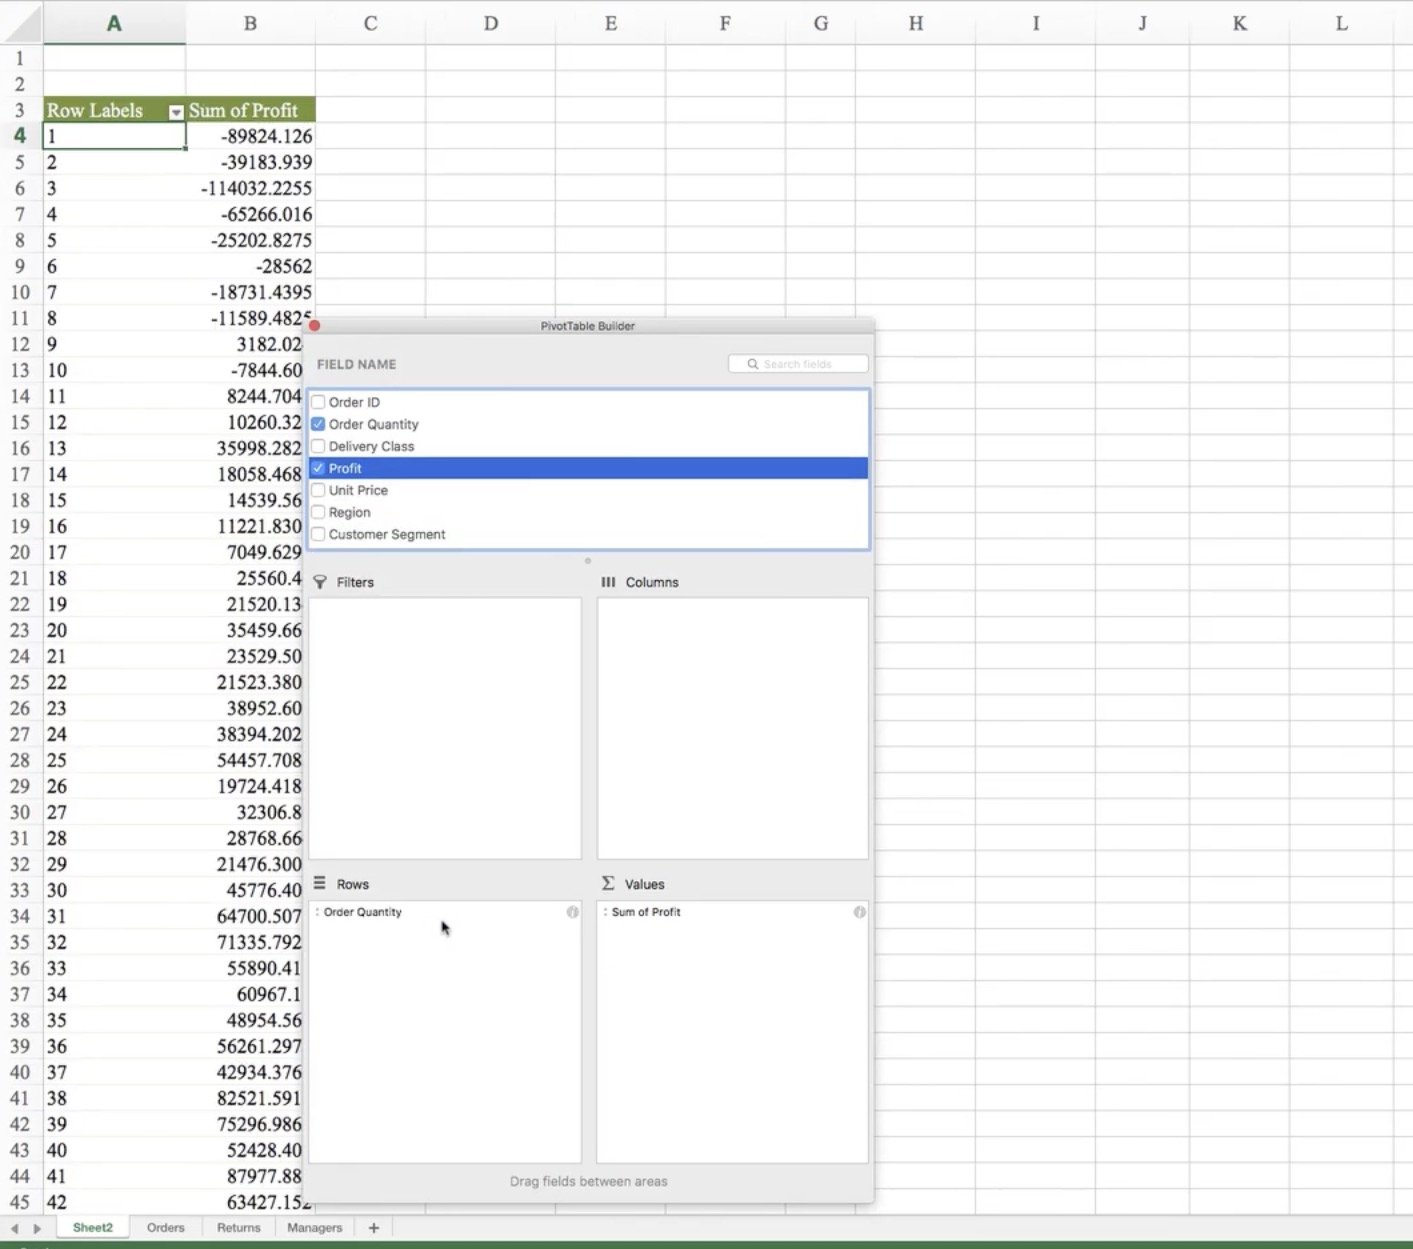
Order Quantity is normally a metric because you might calculate the total number of units sold. But you could also use its distinct values—1, 2, 3, 4 and so on—as categories.
For example, you might ask: How much profit do we make on orders containing one unit, two units or three units? In that analysis, Order Quantity is being used as a dimension because it is grouping the profit metric.
Adam's advice
Beginners often try to memorise a permanent list of metrics and dimensions. It is more useful to ask two questions: What am I measuring? and What am I using to break that measurement down?
A simple rule to remember
Metrics answer “how much?” Dimensions answer “by what?”
That rule will not cover every unusual modelling scenario, but it is an excellent starting point. When building a report, identify the outcome you need to measure and then choose the categories that will make the result useful to the business.
Frequently asked questions
Questions about metrics and dimensions
What is the difference between a metric and a dimension?
A metric is a value you measure or aggregate, such as revenue or profit. A dimension is a category used to group, filter or describe that metric, such as region, product or date.
Are all numeric fields metrics?
No. Numeric identifiers such as Order ID, Customer ID and postcode are usually dimensions because the numbers act as labels rather than quantities to be totalled or averaged.
Are dates metrics or dimensions?
Dates are normally dimensions because they are used to group and filter measurements by day, month, quarter or year. Calculated values such as number of days to deliver may then be used as metrics.
Can one field be both a metric and a dimension?
Yes. A numeric field such as order quantity can be summed as a metric or used as a set of categories to group another metric. Its role depends on the analysis.
What are metrics and dimensions called in Power BI?
The same concepts exist, although terminology varies. Numeric fields and DAX measures provide values, while columns such as category, region and date are used to group or filter those values.
Where to Go Next
Now that you understand the basic building blocks of a report, the next step is to practise combining them in real analysis.