
7 Business Intelligence Terms Every BI Beginner Should Know
A plain-English guide to the language behind data warehouses, SQL, KPIs and dashboards—and how the seven concepts fit together in a real Business Intelligence system.

One of the things that puts people off Business Intelligence at the beginning is the terminology. You hear words like ETL, data warehouse or RDBMS and it can feel like everyone else got given a dictionary that you somehow missed.
So instead of throwing textbook definitions at you, let's go through the seven terms you're most likely to come across and, more importantly, why they actually matter in the real world.
The article is based on the original Learn BI Online video and follows the same seven-part journey, with additional examples and context for readers who want to explore the ideas more deeply.
1Data Silo

Think about a typical company for a minute. Data is everywhere. Sales may use a customer relationship management system. Finance may work with accounting software and spreadsheets. Marketing may collect information through advertising platforms, social networks and website analytics.
Each of those systems can become a data silo. Even two departments inside the same company may hold different versions of what appears to be the same information.
One of the basic aims of Business Intelligence is to make information from these separate systems easier to use together. That may involve querying data where it already lives, connecting systems directly or transferring copies into a central location.
2Data Warehouse

A warehouse contains data copied from operational systems such as sales platforms, finance applications and customer databases. It can hold both current and historical information, allowing analysts to examine how performance has changed over time.
This separation is useful because operational systems are built to run the business: accepting orders, recording payments or managing customer interactions. A data warehouse is structured to make analysis faster, more consistent and less disruptive to those source systems.
Before data enters the warehouse, it can also be cleaned, standardised and organised into a model that better reflects how the business wants to analyse its performance.
A warehouse normally contains a copy of the data
The original application continues collecting and updating operational data. The warehouse receives the information needed for reporting, often on a schedule or through a continuous data pipeline.
3ETL
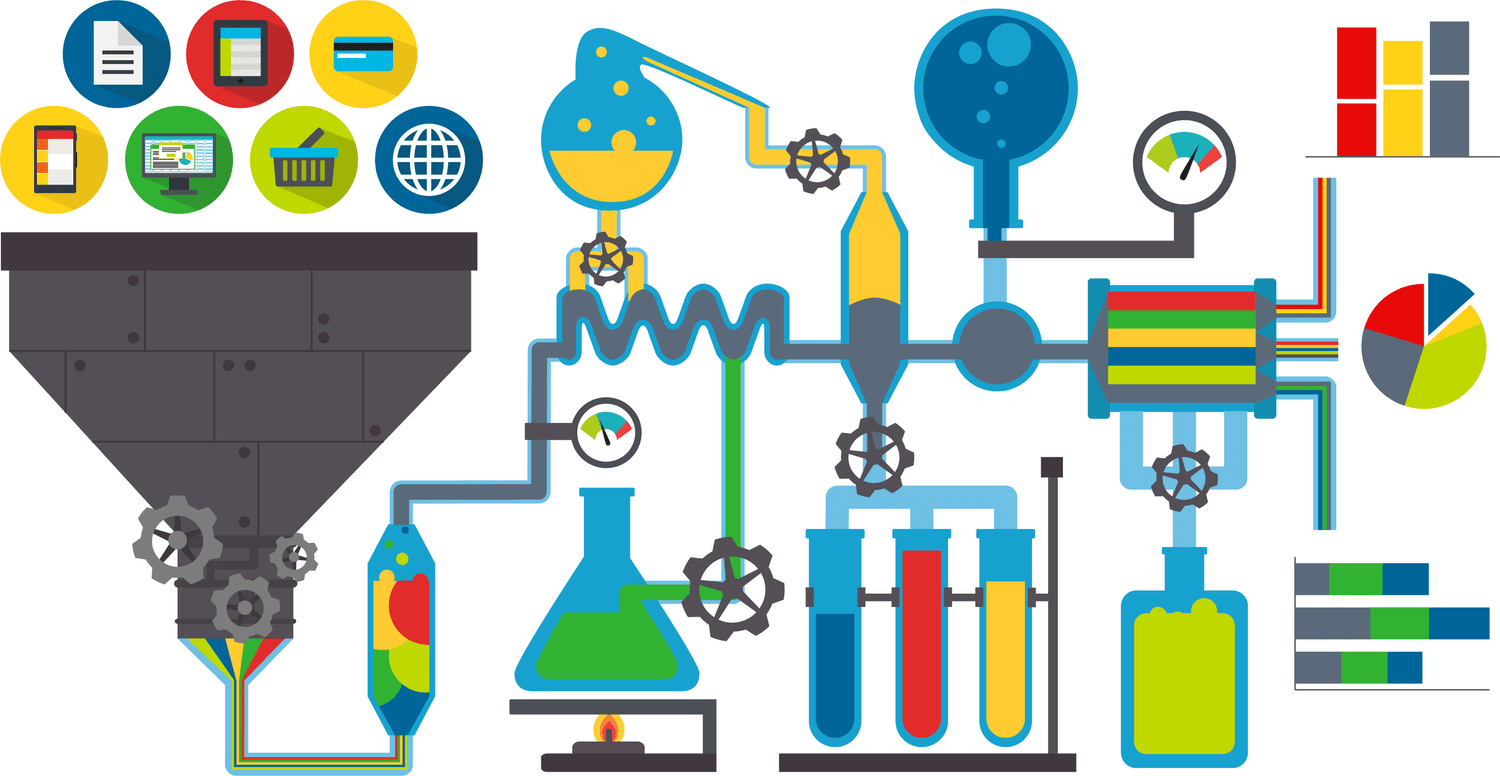
The name describes the three main stages:
- Extract: collect data from databases, spreadsheets, APIs, cloud applications or other sources.
- Transform: clean, standardise, combine or calculate the data so that it is suitable for analysis.
- Load: place the prepared data into a warehouse, data mart or another reporting environment.
ETL helps solve two common BI problems. First, data is distributed across silos that were not designed to work together. Second, those sources may represent information in different formats and structures.
You may also encounter the term ELT, where data is extracted and loaded before transformations are performed in the destination platform. The order changes, but the broader objective remains the same: turn raw, disconnected data into something reliable and useful.
4RDBMS
Common examples include Microsoft SQL Server, PostgreSQL, MySQL and Oracle Database. Microsoft Access is also a familiar desktop example, particularly in older or smaller business environments.
A relational database stores information in tables made up of rows and columns. Those tables are connected through common fields—often called keys—so that related information does not have to be repeated everywhere.
This structure can make data more efficient to store, easier to maintain and more useful for analysis. Many data warehouses use relational principles, although modern analytics platforms can support additional storage models as well.
5SQL
SQL allows an analyst to ask a database for the information required to answer a business question. It can filter records, join tables, group data, calculate totals and create new fields.
For example, an analyst could use SQL to calculate monthly revenue by region, identify customers who have stopped purchasing or compare actual sales with targets.
Database platforms use slightly different SQL dialects, but the core concepts are highly transferable. Once you understand selecting, filtering, joining, grouping and aggregating data, moving between systems becomes much easier.
Why SQL remains a core BI skill
Reporting tools can hide some of the underlying code, and AI can help draft or troubleshoot queries. But analysts still need to understand the data and validate that joins, filters and calculations produce the intended result.
6KPI

Not every metric is a KPI. A metric becomes a key performance indicator when it is directly connected to something the organisation is trying to achieve.
KPIs vary between organisations, departments and objectives. A subscription company might track customer churn. A retailer might focus on gross margin and stock availability. A customer service team might monitor resolution time and satisfaction.
A good KPI has a clear definition, an agreed calculation, a responsible owner and enough context to support action. Displaying a number without explaining what it means or what should happen next rarely improves decision-making.
7Dashboard
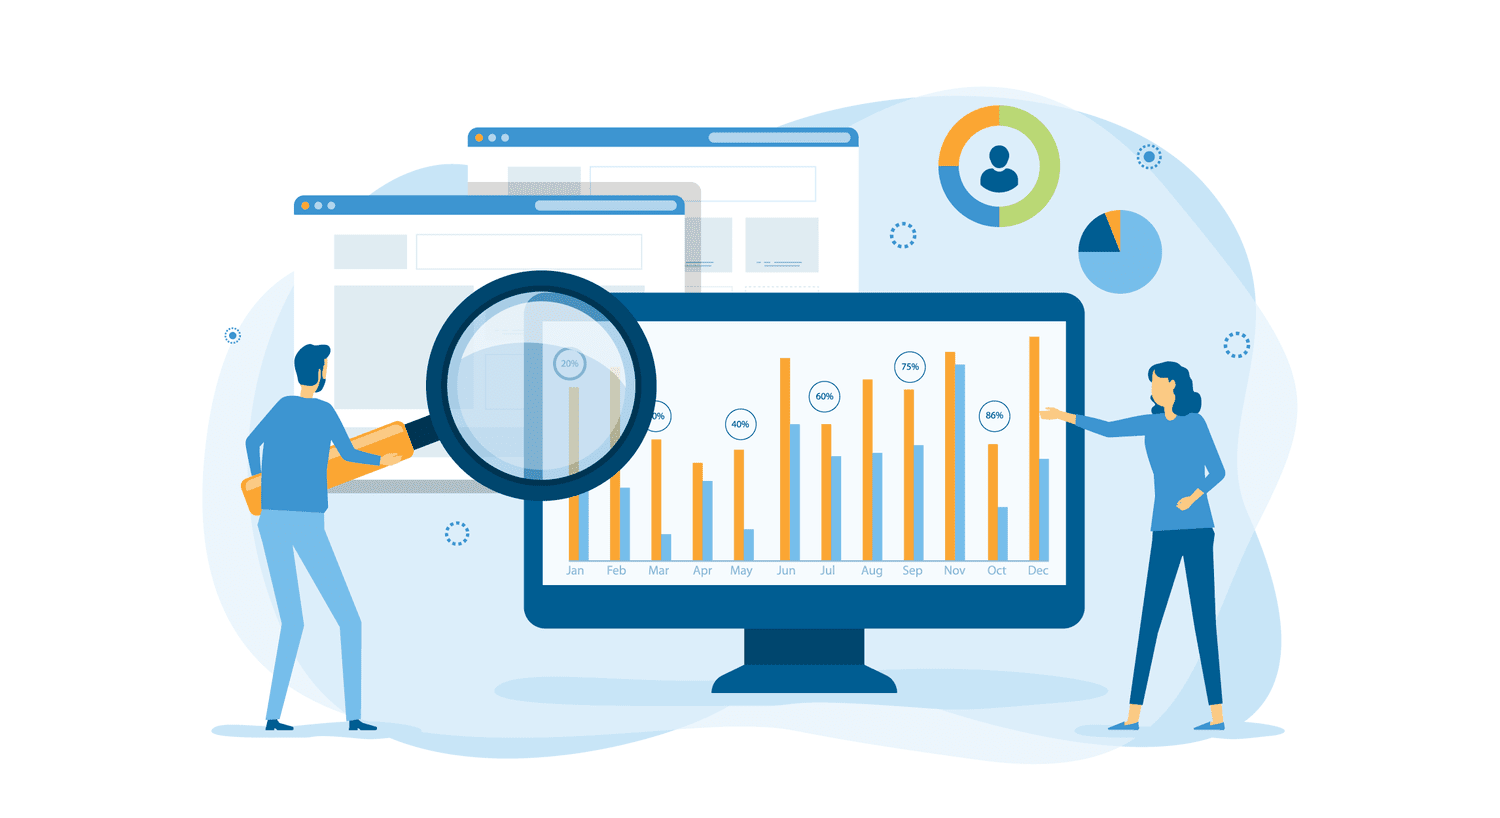
Dashboards typically combine KPIs, charts, tables, filters and supporting detail. Their purpose is not simply to display data. A useful dashboard helps a specific audience understand performance and decide where attention is required.
Some dashboards are operational and update frequently. Others are designed for weekly or monthly management reviews. Some provide a high-level overview, while others allow users to drill into products, regions, customers or time periods.
A dashboard is the visible end of a much larger process
Behind the charts may be source systems, data pipelines, transformation rules, database tables, semantic models, metric definitions and quality checks. The interface is only as trustworthy as the work underneath it.
How the Seven BI Terms Fit Together
These terms are easiest to remember as three stages in one simplified reporting journey. Read the diagram from top to bottom:
Collect and prepare the data
Data begins in separate systems, then has to be extracted, cleaned and prepared before it can be analysed properly.
Store and work with the data
The prepared data is stored in a reporting environment, managed through database technology and queried using SQL.
Turn data into decisions
Agreed measures are presented in dashboards so people can monitor performance, investigate problems and decide what to do next.
Data begins in separate operational systems. A data process extracts and prepares it. The information is brought into a reporting environment, where relational database technology and SQL can be used to organise and query it. Business definitions turn calculations into agreed KPIs, and dashboards present those measures to the people who need them.
Real BI architectures can be more complicated, and not every organisation follows this exact sequence. Cloud platforms, lakehouses, direct-query systems and semantic layers can change the technical design. But the seven terms still provide a useful foundation for understanding the movement from raw data to business decision.
| Term | What it means | Why it matters |
|---|---|---|
| Data silo | A separate source of data. | Explains why information is often fragmented. |
| Data warehouse | A central store designed for analysis. | Creates a consistent reporting foundation. |
| ETL | Extract, transform and load. | Moves and prepares data for use. |
| RDBMS | Software for relational databases. | Manages structured tables and relationships. |
| SQL | A language for querying relational data. | Retrieves, combines and calculates information. |
| KPI | A measure linked to an important objective. | Focuses reporting on performance that matters. |
| Dashboard | A visual interface for monitoring and analysis. | Makes information accessible to decision-makers. |
Where to Go Next
Understanding the terminology gives you a map. The next step is learning how the pieces are used in practice.
Frequently Asked Questions
What is Business Intelligence in simple terms?
Business Intelligence is the process of turning organisational data into useful information for reporting, analysis and decision-making. It includes the systems, methods and people involved in collecting, preparing, analysing and communicating that information.
What is the difference between a database and a data warehouse?
A database is a general system for storing and managing data, often in support of operational activities. A data warehouse is designed specifically to bring together data from multiple sources for analysis and reporting, usually including historical information.
What is the difference between ETL and ELT?
ETL transforms data before loading it into the destination. ELT loads the data first and performs transformations inside the destination platform. Both approaches are used to prepare data for analysis.
Is SQL a Business Intelligence tool?
SQL is a query language rather than a complete BI tool. It is commonly used within BI workflows to retrieve, combine and transform data stored in relational databases and warehouses.
Is every business metric a KPI?
No. A metric is any measurable value. A KPI is a measure considered important because it tracks progress towards a specific objective or critical area of performance.
What makes a good BI dashboard?
A good dashboard is designed for a clear audience and decision. It uses trustworthy data, agreed KPI definitions, appropriate visualisations and enough context to help users understand what requires attention.
Final Thoughts
If you've made it this far, you'll probably have noticed something. None of these ideas are especially complicated on their own. It's mostly the terminology that makes Business Intelligence seem more intimidating than it really is.
Business Intelligence terminology can initially make the field seem more complicated than it is.
At its heart, BI is about bringing data together, preparing it properly, defining what matters and presenting information that helps people make better decisions.
Once you understand how data silos, warehouses, ETL, relational databases, SQL, KPIs and dashboards connect, the wider Business Intelligence landscape becomes much easier to navigate.